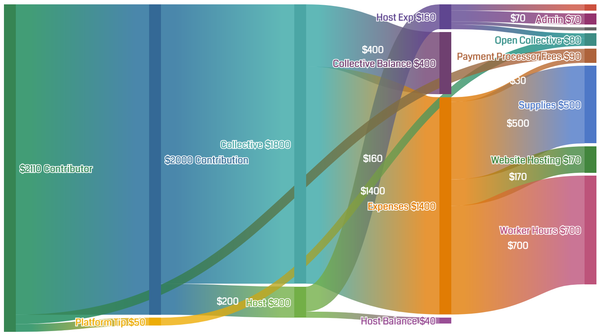
Two interactive graphs with explainer videos, one simplified and one in-depth.
Thanks to the platform's financial transparency, you can trace exactly what
happens to each dollar, and these can explainers show how it all works.
Money Flows: Simplified
Interactive graph → [https://public.flourish.studio/visualisation/7303468/]
Money